Research · 13 October 2026 · 7 min read
How much money do AI agents actually move?
By James Warder
- Agent payments
- x402
- Market data
A number that never moves
Open x402.org and you see four numbers under the heading "Last 30 Days": 75.41M transactions, $24.24M in volume, 94.06K buyers and 22K sellers.
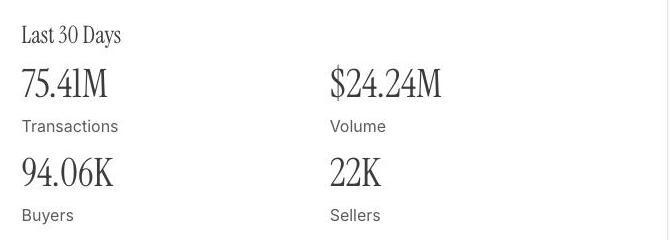
x402.org, read 13 October 2026.
We noticed the same figures, rounded, in our own notes on 28 July. They were still there on 13 October. So we looked at the page source. The four numbers are plain text inside a WordPress text block, between the h2 tags. No script fetches them. No data source sits behind them. They are a headline someone typed.
That is not a scandal. Marketing pages carry stale numbers all the time. But this one gets quoted. It ends up in pitch decks, research notes and conference talks, usually multiplied by twelve. A typed headline is not data, and $24.24M a month is roughly twenty times what filtered data shows.
One protocol, four numbers
Here is every public figure we could find for x402 payment volume, converted to a monthly rate so they can sit on the same axis.
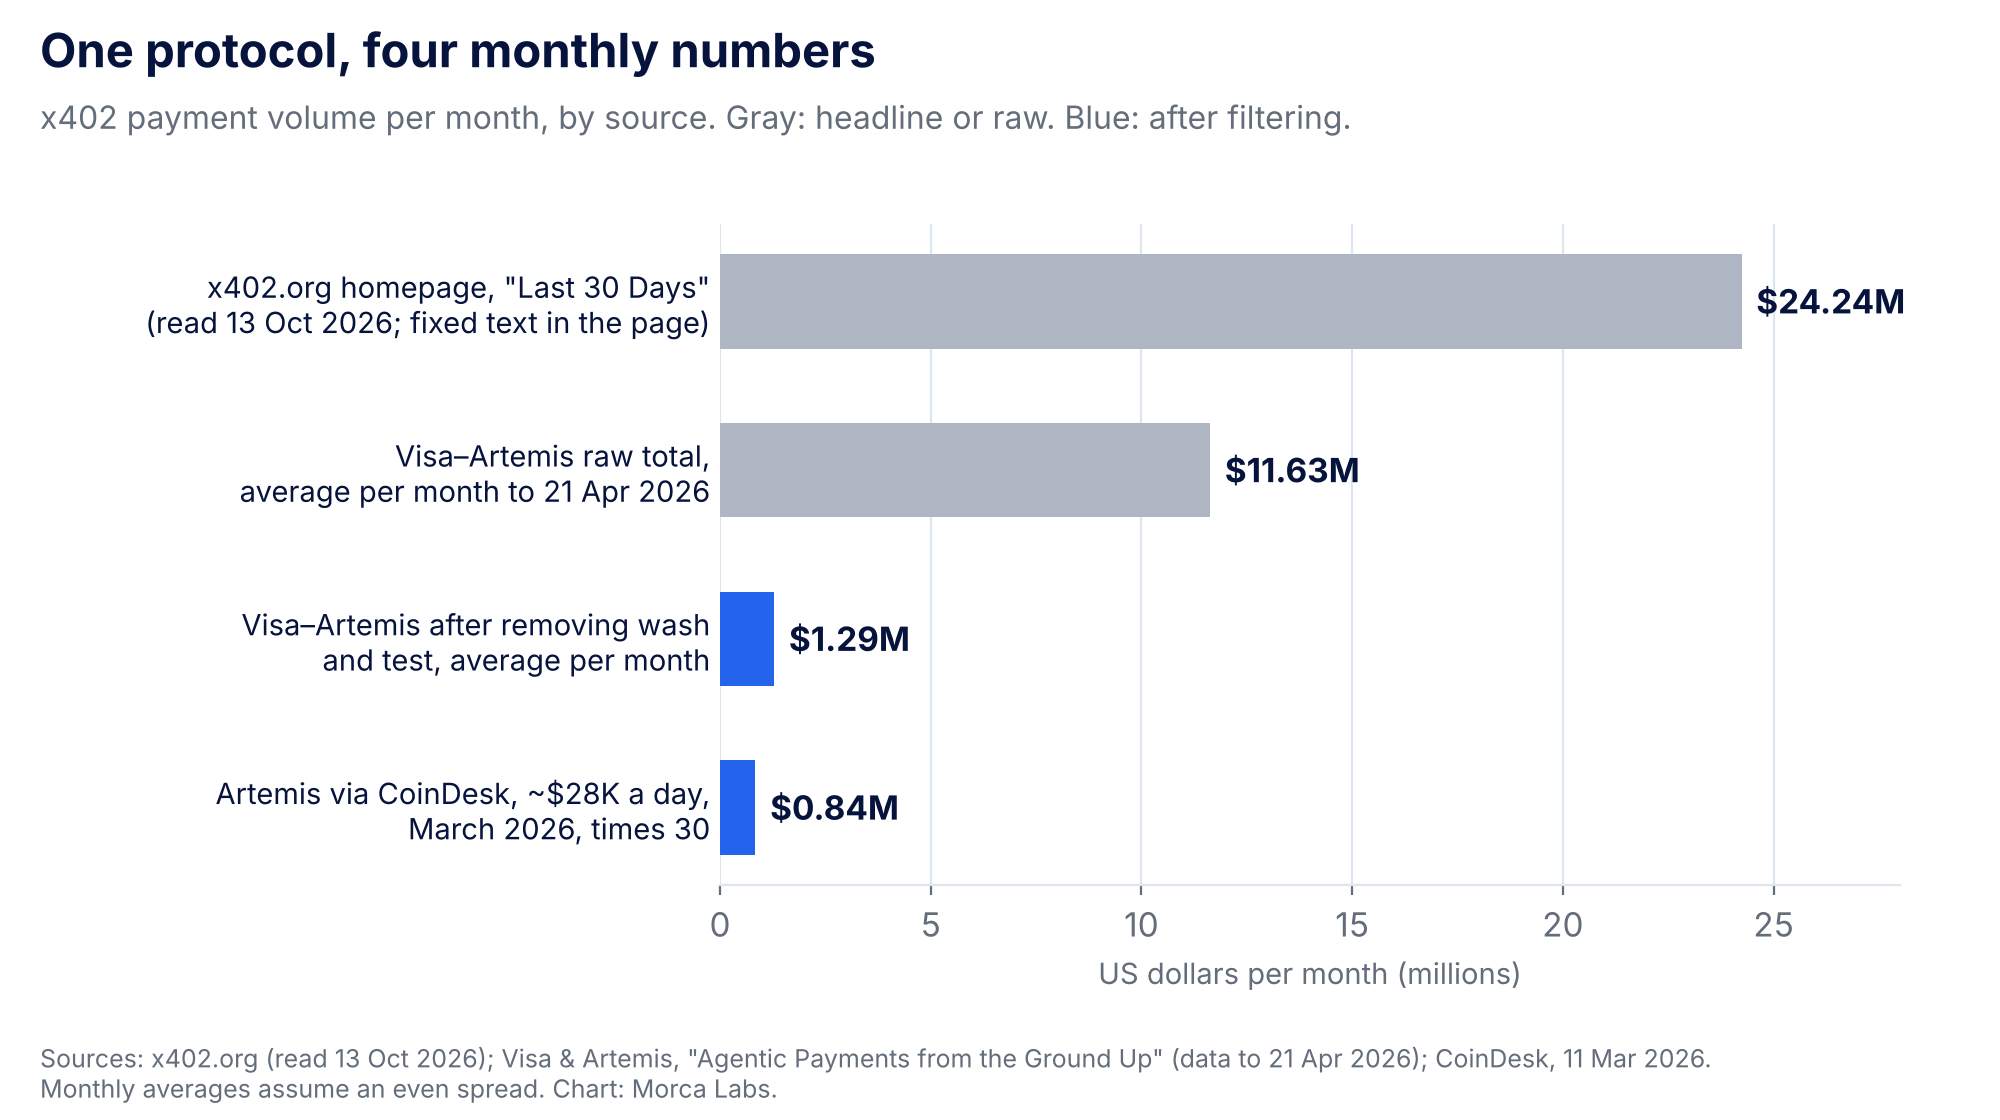
- The homepage: $24.24M in "the last 30 days", as typed.
- Visa and Artemis, raw: $135.7M across 178.3M transactions from launch in May 2025 to 21 April 2026. That is about $11.6M a month if spread evenly. (Visa and Artemis, Agentic Payments from the Ground Up)
- Visa and Artemis, adjusted: $15.0M across 109.6M transactions over the same period, after excluding "identified wash and test activity". That is about $1.3M a month. (Visa summary page)
- Artemis via CoinDesk: about $28,000 a day in March 2026 at about $0.20 a payment. That is about $0.84M a month. Artemis also said roughly half of observed transactions looked gamed. (CoinDesk, 11 March 2026)
The two blue bars come from different windows and different methods, and they still land within a factor of two of each other. The gray bars are ten to thirty times higher. Whatever the true number is, it is much closer to blue than to gray.
What filtering removes
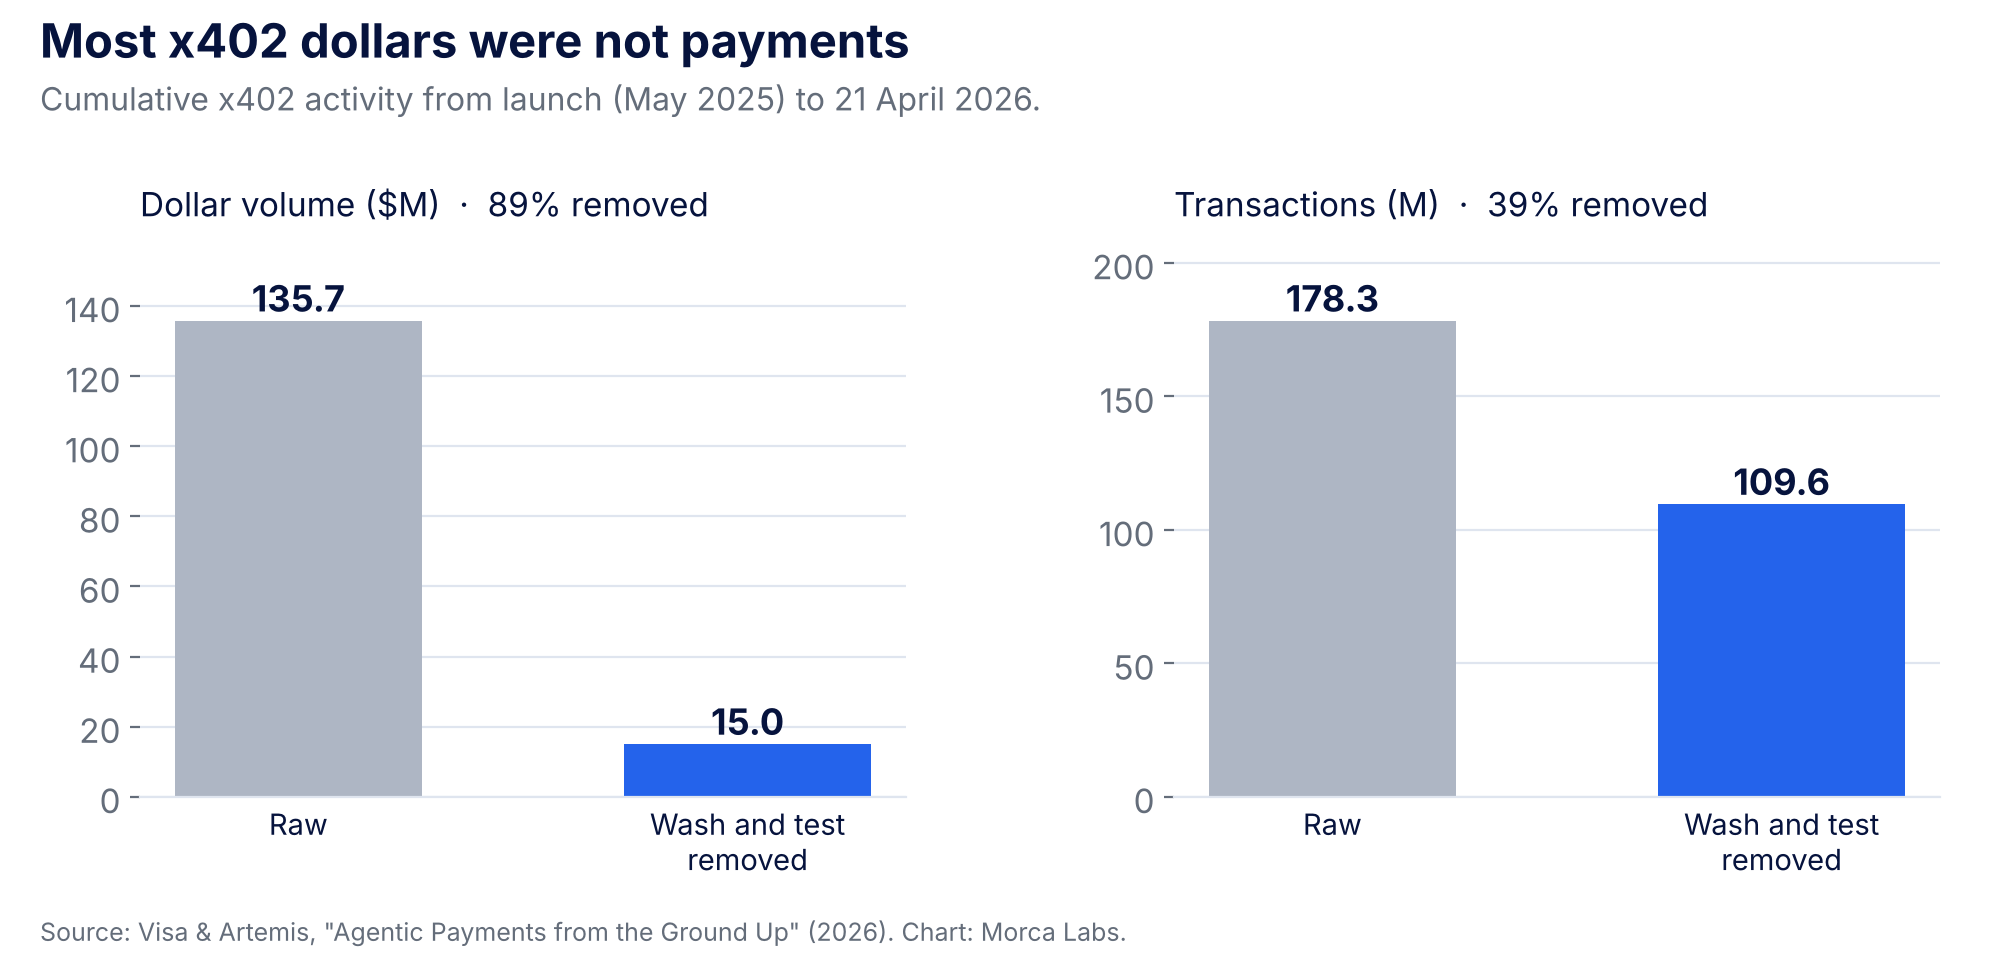
The filter removed 39% of the transactions but 89% of the dollars. Read that slowly. The fake activity was not mostly fake count. It was fake value. Large self-transfers and test sends inflate the dollar total far more than they inflate the count.
Chainalysis described the same shape from another angle. In the fourth quarter of 2025, x402 transactions on Base rose more than 10,000% in a single week, driven largely by a meme coin called PING. PING alone processed over 150,000 transactions in its first month. Weekly wallet retention spiked to 87% in October 2025 during the rush, then fell to 5%. (Chainalysis, 3 June 2026)
A meme-coin rush is real activity. It is not agents buying things.
What one payment is worth
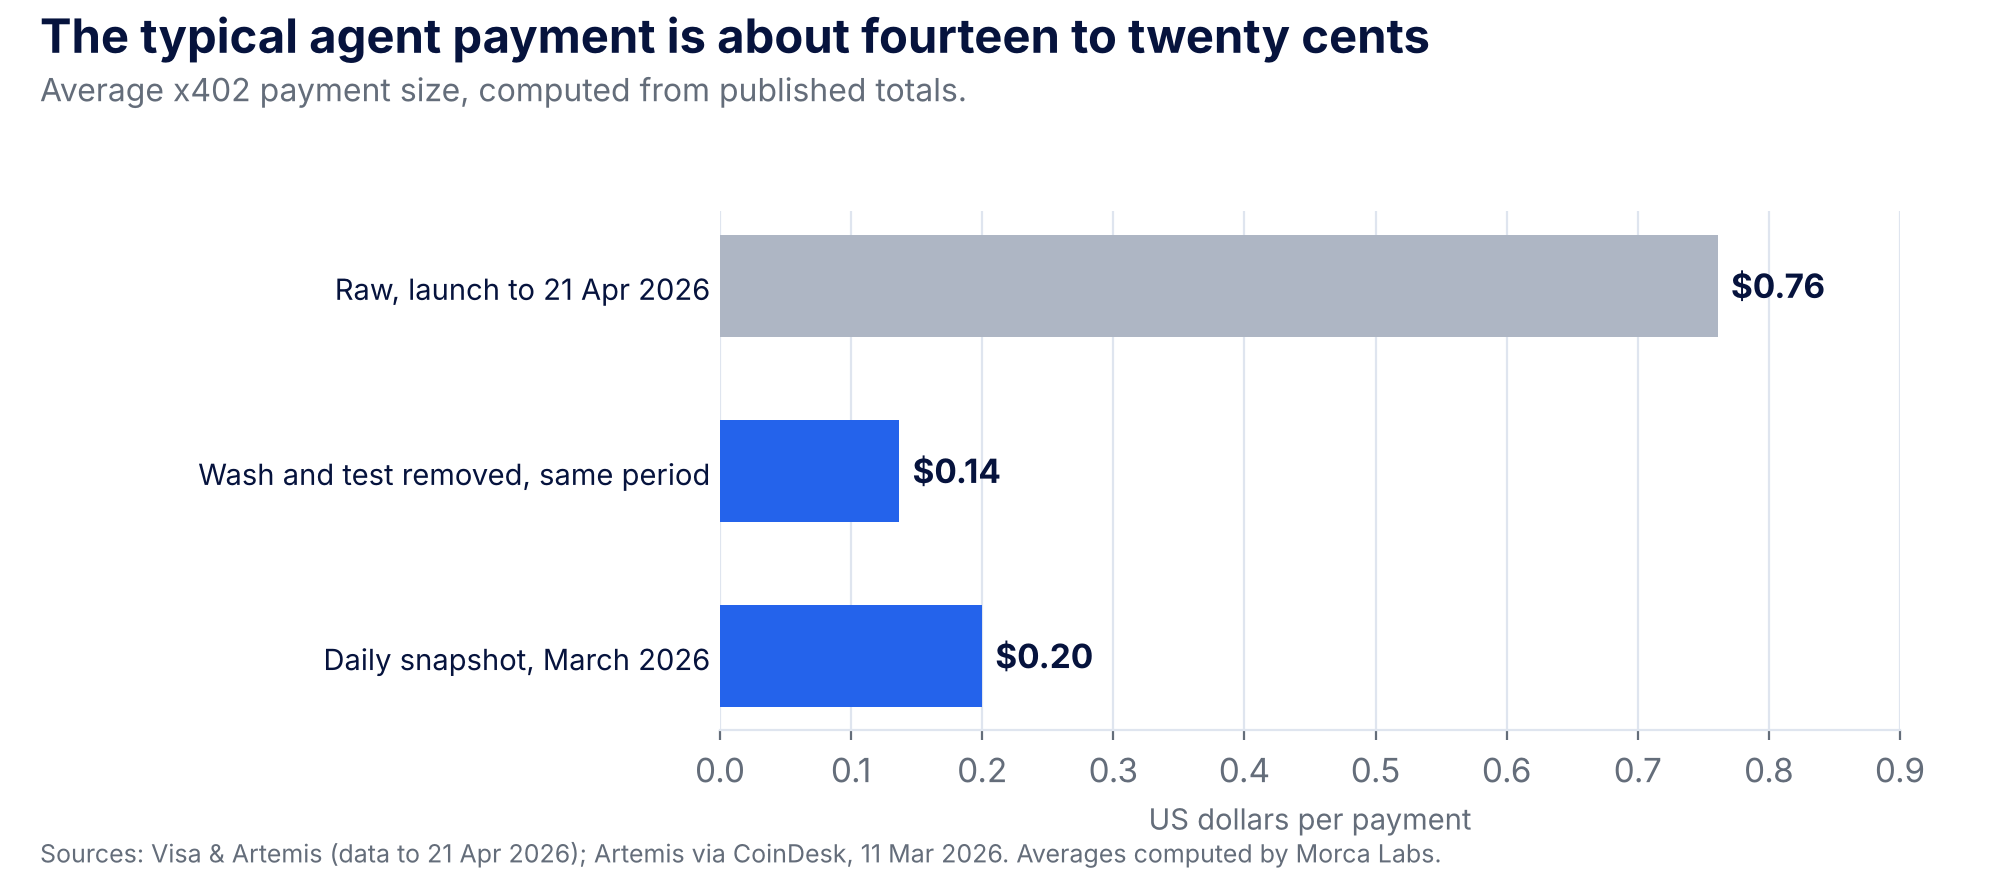
After filtering, the average x402 payment is about $0.14. The March snapshot says $0.20. Those are the prices of an API call, a weather lookup or a page of data.
There is one honest counterpoint, and it is worth stating plainly. Chainalysis found that payments of $1 or more grew from 49% of volume in early 2025 to 95% in early 2026. So the mix is moving toward larger payments. But 95% of $1.3M a month is still about $1.2M a month. The mix is moving toward bigger payments. The total is still small.
Who benefits from which number
Two serious sources disagree on where x402 activity happens. Visa and Artemis say Base carries "the vast majority of transaction volume". In the Linux Foundation's launch release for the x402 Foundation, a Solana Foundation spokesperson said Solana drives "nearly 65% of x402 transaction volume this year", with no window or method given. (Linux Foundation, 2 April 2026)
Both statements can be true for different windows. Neither can be checked from what was published. We do not take a side. We point out that each number came from someone with a reason to want it large, which is the last question on the checklist we use for every metric (see The primitive clock).
So where does agent money actually move?
The more useful question is where agents put real third-party money at risk. Losses answer that better than volume does, because losses are hard to fake and someone always writes them up.
| Date | What happened | Approximate loss | What kind of agent |
|---|---|---|---|
| Jan 2026 | Polycule, a Telegram trading bot for prediction markets, was compromised | $230,000 in user funds (Phemex) | Trading bot |
| 22 Feb 2026 | Lobstar Wilde, an automated trading bot, was asked for 4 SOL and sent its entire token holding, about 5% of supply | About $250,000 at the time (The Block) | Trading bot |
| 4 May 2026 | A user had Grok decode a Morse-code message and relay it to Bankrbot, which transferred 3 billion DRB tokens | $150,000 to $200,000, depending on the source (AI Incident Database #1556) | Token bot |
Every one of them is a trading or token bot holding a balance. None is an agent paying fourteen cents for an API call. That matches what we see when we build: the agents people trust with real money today trade, rebalance and hold positions. The payments are still cents.
Nobody we found publishes a credible, method-backed total for capital managed by agents. We looked. If you see one, check whether it has a method section before you repeat it.
What this means if you are building
- Do not size a business on agent-payment volume. The honest number is about a million dollars a month across the whole protocol. That is a promising start for a standard and too small for a market.
- Build where the money already is. Trading and yield agents hold balances, and balances are what get lost. The safety problem is there today, not in some future payment economy.
- Read every agent metric with the same seven questions. Who pays for the number? Count or value? Average size? Unique participants? Incentives? One chain or many? Who benefits if it is big? We wrote them up in The primitive clock.
What would change our mind
- An organic, method-published payment figure above $10M a month, about ten times today's filtered rate.
- Cohort retention showing that the same buyers keep paying month after month, outside a meme or incentive spike.
- A disclosed, audited total of capital that agents manage for people other than their developers.
If any of these appears, we will update this post and say what changed.
Method
All figures are from public sources read between 11 and 13 October 2026. Monthly averages divide a cumulative total by 11.67 months (early May 2025 to 21 April 2026) and assume an even spread, so they show scale, not trend. Average payment sizes are our own division of published totals. We read the x402.org page source on 13 October 2026 to confirm the "Last 30 Days" figures are static text. Charts are ours.
Disclosure: Morca Labs builds Gol, which puts spending limits for AI agents into a contract on the owner's own account. Our first users are traders. We have a reason to prefer the conclusion that trading is where agent money moves, so we have tried to show every number we used.
Sources
- Visa and Artemis, Agentic Payments from the Ground Up (report PDF)
- Visa, summary page
- CoinDesk, 11 March 2026
- Chainalysis, Inside x402, 3 June 2026
- Linux Foundation, x402 Foundation launch, 2 April 2026
- x402.org, read 13 October 2026
- The Block on Lobstar Wilde · AI Incident Database #1556 · Phemex on Polycule